Analyzing Stadium Influences on Results Across Football, Basketball, and Baseball
Iris Krause · Jul 8, 2026

Analyzing Stadium Influences on Results Across Football, Basketball, and Baseball
Stadium environments shape competitive edges in professional football, basketball, and baseball through factors like travel demands, surface conditions, and crowd dynamics, according to historical performance records maintained by league offices. Observers note these elements combine in ways that produce measurable differences in win rates when teams play at home versus away. Data compiled across multiple seasons shows home teams in these sports secure victories at rates that exceed random chance, yet the strength of those patterns varies by sport and specific venue characteristics.
Gridiron Settings and Their Effects
Football stadiums present unique challenges tied to weather exposure and field dimensions, which researchers tracking NFL statistics have documented since the league's expansion eras. Cold-weather venues often correlate with lower scoring outputs during late-season games, while domed facilities maintain more consistent environmental controls that benefit passing offenses. Travel across time zones adds another layer, as teams crossing multiple zones show reduced performance metrics in the first quarter of away contests, based on play-by-play logs archived by the league.
Altitude plays a documented role at certain mountain sites where thinner air affects player endurance during extended drives. League records indicate visiting squads at these locations experience higher fatigue indicators in the second half, whereas home units accustomed to the conditions maintain steadier output. Crowd noise levels also disrupt communication on offense, leading to elevated false-start penalties for road teams in high-decibel environments.
Hardwood Dynamics in Basketball Arenas
Basketball courts introduce variables centered on back-to-back scheduling and court-specific quirks that accumulate over an 82-game slate. NBA tracking data reveals teams playing consecutive nights on the road post lower shooting percentages from beyond the arc, particularly in the fourth quarter when legs tire. Venue altitude again surfaces as a factor in cities like Denver, where thinner air influences recovery between possessions and contributes to elevated scoring totals for acclimated home squads.
Floor surfaces vary subtly in bounce and grip across arenas, and visiting players report adjustments that take several minutes to internalize during warm-ups. Statistical reviews of player tracking systems show slight dips in assist-to-turnover ratios for road teams during the opening minutes of games at unfamiliar venues. Scheduling clusters around holidays or midweek slots amplify these effects when combined with longer flights between Eastern and Western conference sites.
Diamond Factors in Baseball Parks
Baseball ballparks feature outfield walls and foul territory sizes that create pronounced park factors, which sabermetric analyses have quantified for decades. Dimensions at venues like Boston's historic park favor left-handed pull hitters, while expansive center fields in other locations suppress extra-base hits and inflate fly-ball out counts. Pitchers who rely on ground-ball tendencies post stronger earned-run averages at parks with shorter foul lines that convert pop-ups into outs more readily.
Weather patterns in open-air stadiums influence ball flight and grip on the mound, with humidity levels tracked by meteorology services correlating to changes in home-run rates during summer months. In July 2026, several clubs scheduled extended home stands that capitalized on these familiar conditions amid the All-Star break recovery window. Visiting clubs often encounter different mound heights and bullpen layouts that require rapid adaptation, and box-score aggregates show modest increases in walks issued by road pitchers during the first three innings at new parks.
Comparative Patterns Across Leagues
Cross-sport comparisons indicate football venues deliver the most consistent home edges due to limited schedule length and pronounced environmental variables, while basketball spreads advantages more evenly because of frequent travel. Baseball sits between the two, with park factors producing larger variance in offensive statistics than defensive ones. Studies from institutions such as the National Bureau of Economic Research have examined these differentials using regression models that control for team strength and rest days.
League offices publish annual home-and-away splits that allow ongoing monitoring of these trends. Data from the 2025 season, for instance, showed football home teams winning roughly 58 percent of contests, basketball squads securing 55 percent at home, and baseball clubs finishing near 53 percent. These figures shift slightly year to year yet remain stable enough for pattern recognition across multiple decades of records.
Conclusion
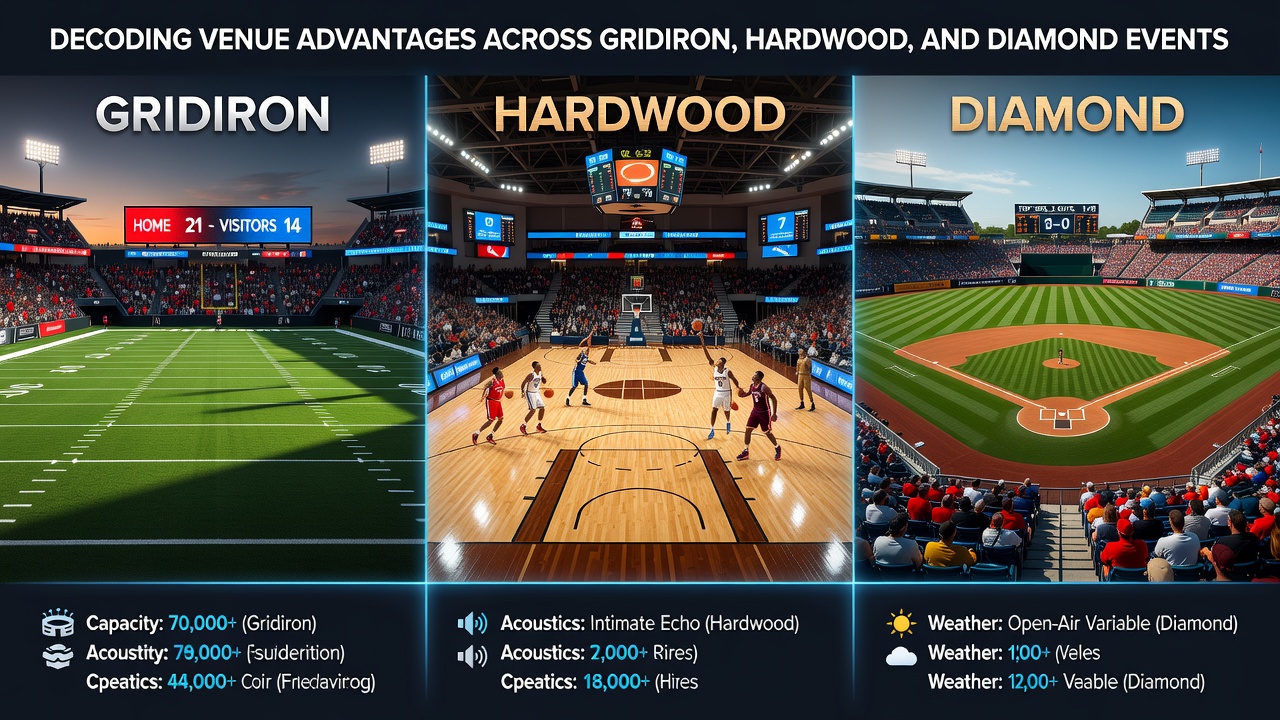
Venue characteristics across gridiron, hardwood, and diamond events create layered influences that accumulate into observable performance gaps. Travel logistics, surface adaptations, and atmospheric conditions each contribute measurable components, and statistical repositories maintained by the leagues provide the raw material for continued examination. Observers tracking these elements gain clearer insight into why certain locations consistently tilt results toward the home side.