How Elevation Levels Reshape Basketball Scoring Trends and Projection Models
Sam Richter · May 20, 2026
How Elevation Levels Reshape Basketball Scoring Trends and Projection Models
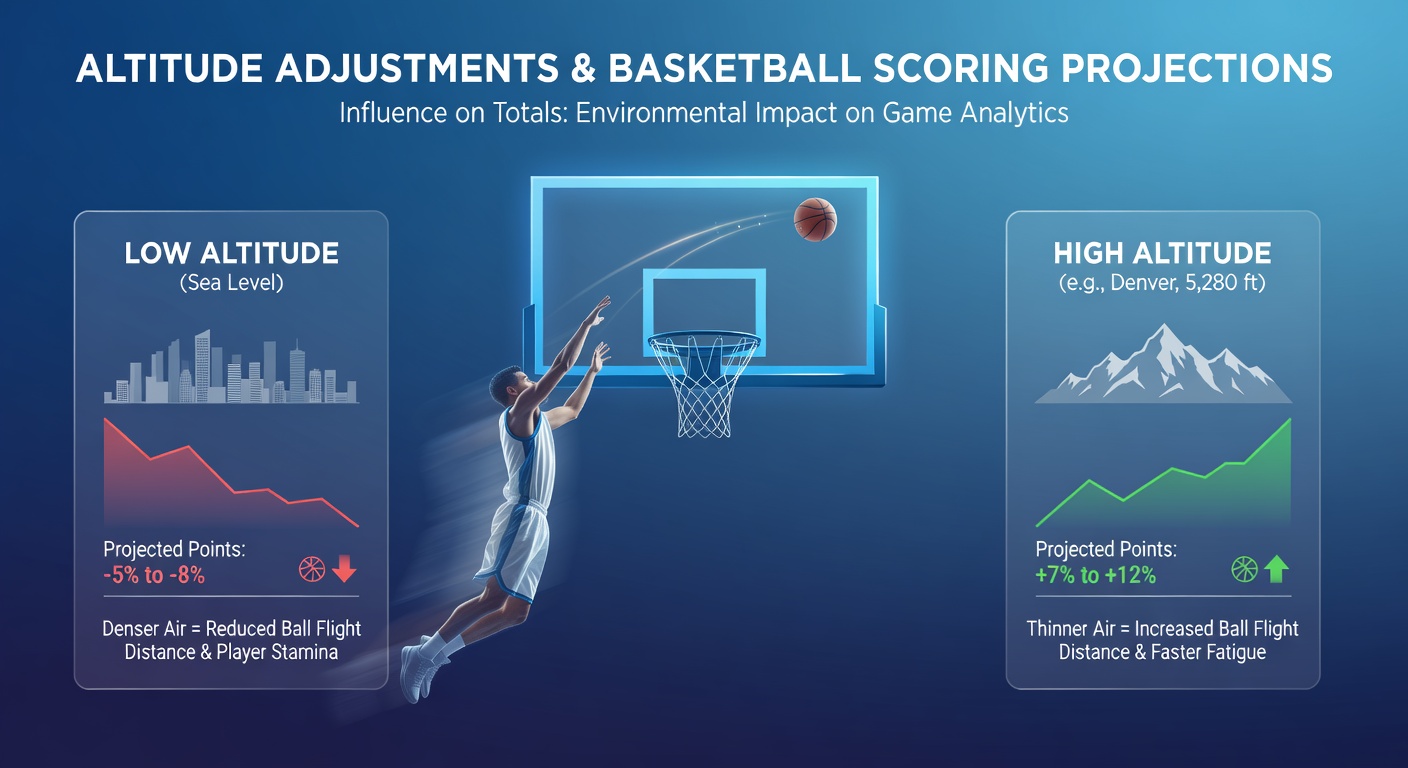
High-altitude venues create measurable shifts in basketball performance because thinner air reduces oxygen availability which affects player endurance and ball trajectory while also prompting analysts to recalibrate scoring projections and totals accordingly and these adjustments draw from decades of performance data across multiple professional leagues.
Physiological Responses to Reduced Oxygen at Elevation
Players who arrive at venues situated above 5,000 feet experience faster fatigue during high-intensity bursts because their bodies work harder to maintain normal oxygen saturation levels and studies conducted by exercise physiologists at institutions such as the University of Colorado have tracked heart-rate spikes and lactate thresholds that rise more quickly in these conditions compared with sea-level environments.
Visiting teams typically show the most pronounced effects during the first half of games while local squads who maintain year-round training at altitude demonstrate improved adaptation through increased red-blood-cell production and this contrast leads to divergent scoring patterns where home teams maintain steadier output in later quarters.
Ball Flight and Shooting Accuracy Changes
Thinner air allows the basketball to travel farther and with less drag so three-point attempts and long-range jumpers often find the net at higher rates than projected models based on sea-level statistics predict and data compiled over recent NBA seasons shows Denver hosting games with average three-point percentages climbing 2 to 4 points above league norms when opposing teams have limited acclimation time.
Coaches adjust practice regimens before road trips to high-elevation sites by incorporating hypoxic training masks and shorter recovery intervals yet these preparations rarely eliminate the full impact on perimeter shooting and interior finishing which collectively push game totals upward in statistical forecasts.
Historical Scoring Data and Projection Adjustments
League-wide records reveal that games played in Denver produce totals approximately 8 to 12 points higher than the season average for both teams combined and analysts incorporate these venue-specific multipliers into projection algorithms by weighting recent performance splits for each roster against historical altitude benchmarks gathered since the 1990s.
During May 2026 playoff scheduling several Western Conference matchups scheduled at altitude venues prompted oddsmakers to raise over-under lines by margins that reflected both team travel schedules and player availability reports and such refinements help maintain accuracy when models incorporate real-time injury data alongside environmental factors.
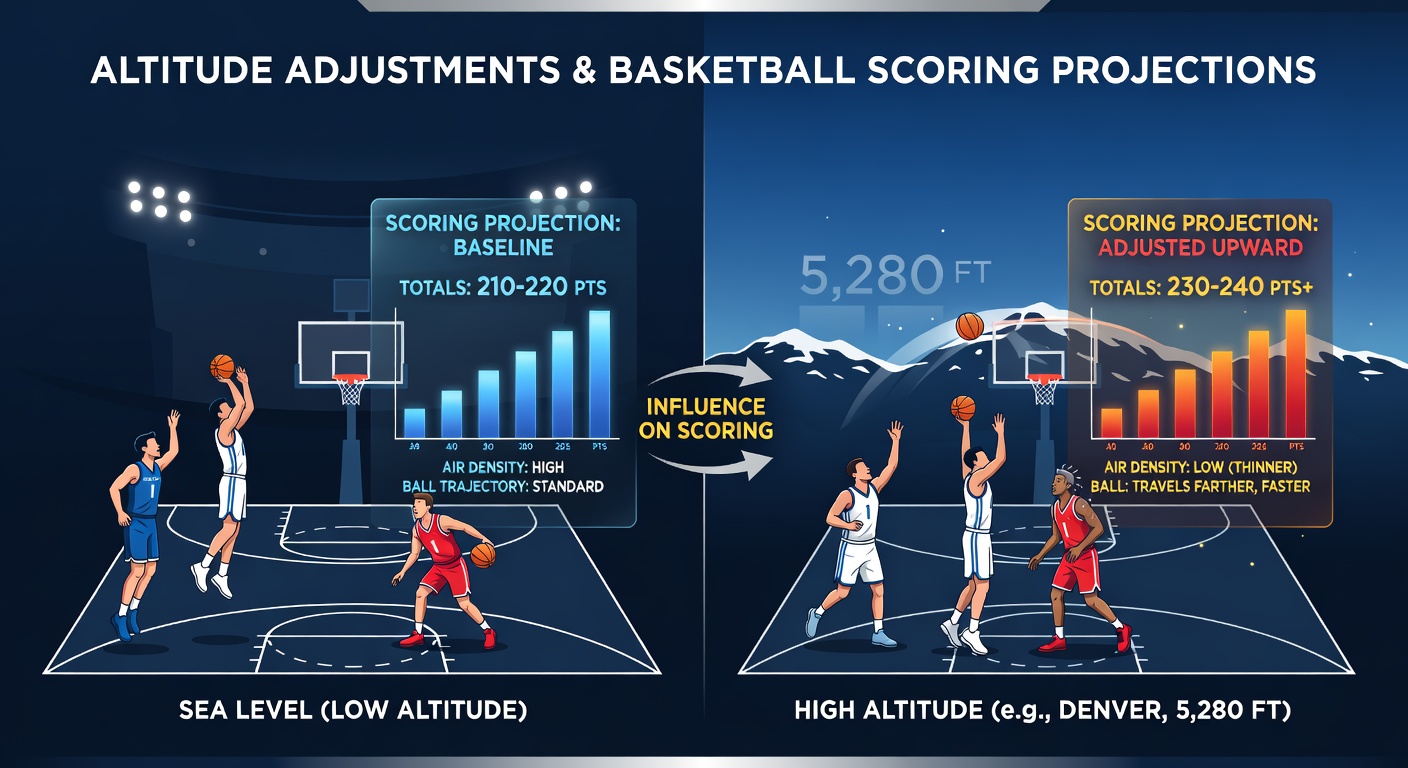
Researchers who examined box scores from more than 200 altitude contests found that second-half scoring margins narrow for visiting squads because accumulated oxygen debt reduces defensive rotations and transition speed while home teams exploit these windows to extend leads and this pattern repeats across multiple seasons prompting projection systems to apply dynamic adjustments rather than static averages.
Comparative Analysis Across Different Venues
Although Denver remains the most prominent example other locations such as Mexico City and certain mountain resorts used for exhibition events introduce similar but milder variables that projection teams evaluate through comparative modeling and international basketball federations have published guidelines that encourage medical monitoring for athletes competing at elevations exceeding 4,000 feet.
Statistical services now integrate atmospheric pressure readings taken on game day into their algorithms because even small fluctuations in humidity and barometric conditions compound the baseline altitude effect and these layered inputs allow for more precise totals forecasts that account for both roster composition and environmental context.
Case Examples from Recent Seasons
One notable instance involved a visiting Eastern Conference squad that posted its lowest three-point volume of the season during a back-to-back set in Denver yet still exceeded projected points because turnovers and fast-break opportunities increased under fatigued defensive conditions and analysts updated subsequent models to reflect this dual dynamic of reduced efficiency paired with higher pace.
Another example emerged when a Western Conference team with multiple players born and raised at elevation maintained consistent scoring output across road and home altitude games while their opponents saw sharp declines in effective field-goal percentage during the fourth quarter demonstrating how roster demographics influence the magnitude of projection corrections.
Conclusion
Altitude adjustments have become standard components within basketball analytics frameworks because empirical evidence consistently demonstrates their influence on both individual performance metrics and aggregate game totals and organizations that incorporate these variables alongside travel fatigue and acclimation timelines produce more reliable forecasts for upcoming contests.