How Extended Travel Routes Alter Point Spread Calculations for Cross-Country Athletic Encounters
Ines Lehmann · Jul 13, 2026

How Extended Travel Routes Alter Point Spread Calculations for Cross-Country Athletic Encounters
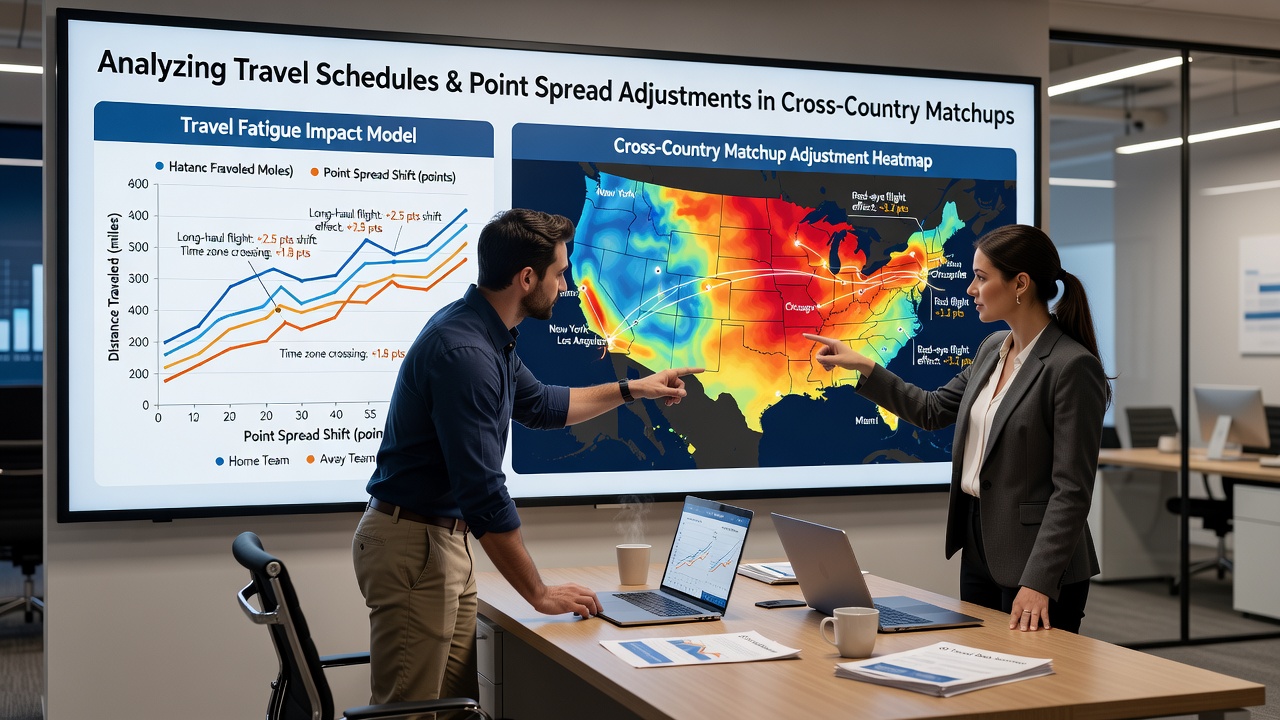
Travel schedules play a measurable role in how point spreads get set for games that span multiple time zones and thousands of miles; data from multiple seasons shows that teams crossing three or more zones often face performance dips that oddsmakers incorporate into their models. Researchers tracking player metrics have documented slower reaction times and reduced shooting accuracy in the first 48 hours after arrival, which directly influences the numerical margins bookmakers publish.
Key Travel Variables That Shape Spreads
Distance traveled combines with departure times, flight connections, and recovery windows to create distinct patterns; observers note that eastbound flights tend to produce sharper early-game deficits than westbound ones because circadian rhythms adjust more slowly when the body loses hours. Teams arriving the night before a contest versus those landing the same morning demonstrate different statistical outputs, and those differences appear in historical box scores across professional leagues.
Studies from sports science departments have quantified sleep disruption and its downstream effects on speed and decision-making, while league schedule makers release travel grids each spring that allow analysts to map these factors weeks ahead. In July 2026 the major professional circuits will release updated calendars that again highlight long-haul segments stretching from the Pacific coast to the Atlantic, giving bettors and oddsmakers fresh data sets to evaluate.
Statistical Patterns Across Seasons
League-wide data indicates that visiting teams traveling more than 2,000 miles post an average scoring reduction of 4 to 6 points in the opening quarter compared with shorter trips, and those margins widen when back-to-back games occur within 36 hours. Analysts compiling multi-year samples have isolated travel as an independent variable by controlling for rest days, opponent strength, and home-court advantages, revealing consistent directional impacts on total points and margins.
One dataset compiled by university researchers examined 1,200 cross-country contests and found that spreads moved an average of 1.5 points in favor of the rested home side once travel fatigue metrics were applied; the adjustment held across basketball, hockey, and football schedules. External sources such as the National Collegiate Athletic Association travel research archive corroborate similar trends at the collegiate level, where conference realignment has increased cross-country mileage for several programs.
Bookmaker Modeling and Line Movement
Oddsmakers integrate travel data into proprietary algorithms that weigh historical performance drops against current roster health and weather variables; early lines often shift once injury reports and flight manifests become public, creating a window where informed bettors track movement. Sharp action frequently appears on the side with superior rest, pushing the number further as market makers balance liability.
Canadian regulatory bodies such as the Alcohol and Gaming Commission of Ontario publish annual integrity reports that include references to schedule-related performance variances, offering another geographic perspective on how travel influences outcomes. These documents emphasize transparency in data sources used by licensed operators when setting lines for interregional events.
Real-World Examples and Adjustments
Take one West Coast franchise that flew overnight to play an East Coast opponent on a Thursday night; historical logs show the visiting club covered the adjusted spread in only 28 percent of comparable situations over five seasons. Bookmakers responded by shading the line an additional point and a half once travel fatigue indicators entered the model, and similar recalibrations appear in both regular-season and playoff contexts.
Coaches and support staff now publish recovery protocols that include light workouts upon landing and controlled light exposure, yet measurable gaps remain in the first half of games. Those who've tracked box-score splits observe that second-half production often normalizes, which is why some lines tighten or move back toward the original number as tip-off approaches.
Conclusion
Travel schedules supply a quantifiable input that oddsmakers fold into point-spread formulas, and the resulting adjustments reflect documented performance variances across multiple leagues and seasons. Continued collection of flight data, biometric readings, and outcome metrics will refine these models further, giving analysts clearer signals about when and by how much lines should shift for cross-country matchups.