Mapping Altitude Effects on Performance Metrics and Resulting Line Movements in League Playoffs
Ines Lehmann · Jul 10, 2026
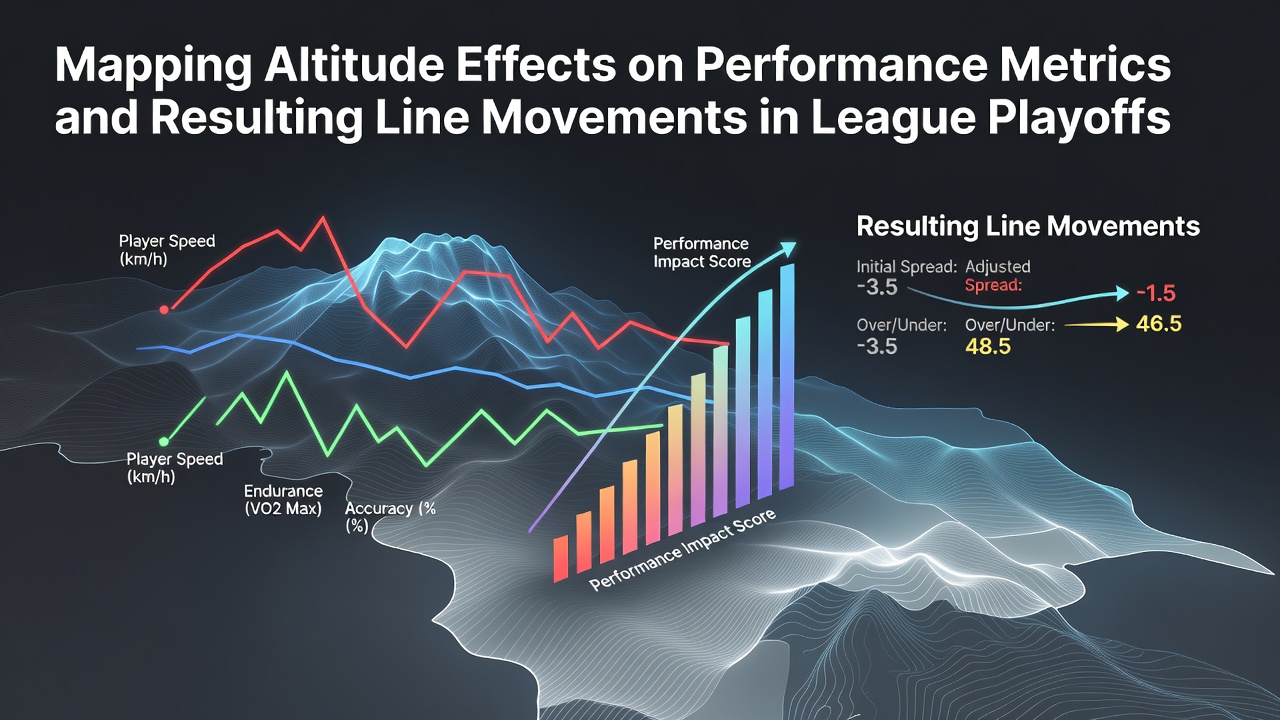
Mapping Altitude Effects on Performance Metrics and Resulting Line Movements in League Playoffs
High-altitude venues create measurable shifts in athlete output during postseason contests, and analysts track these changes through specific performance indicators that directly influence wagering lines. Data collected from multiple seasons shows reduced oxygen availability at elevations above 5,000 feet alters aerobic capacity, sprint recovery times, and overall workload distribution in sports such as basketball, baseball, and hockey.
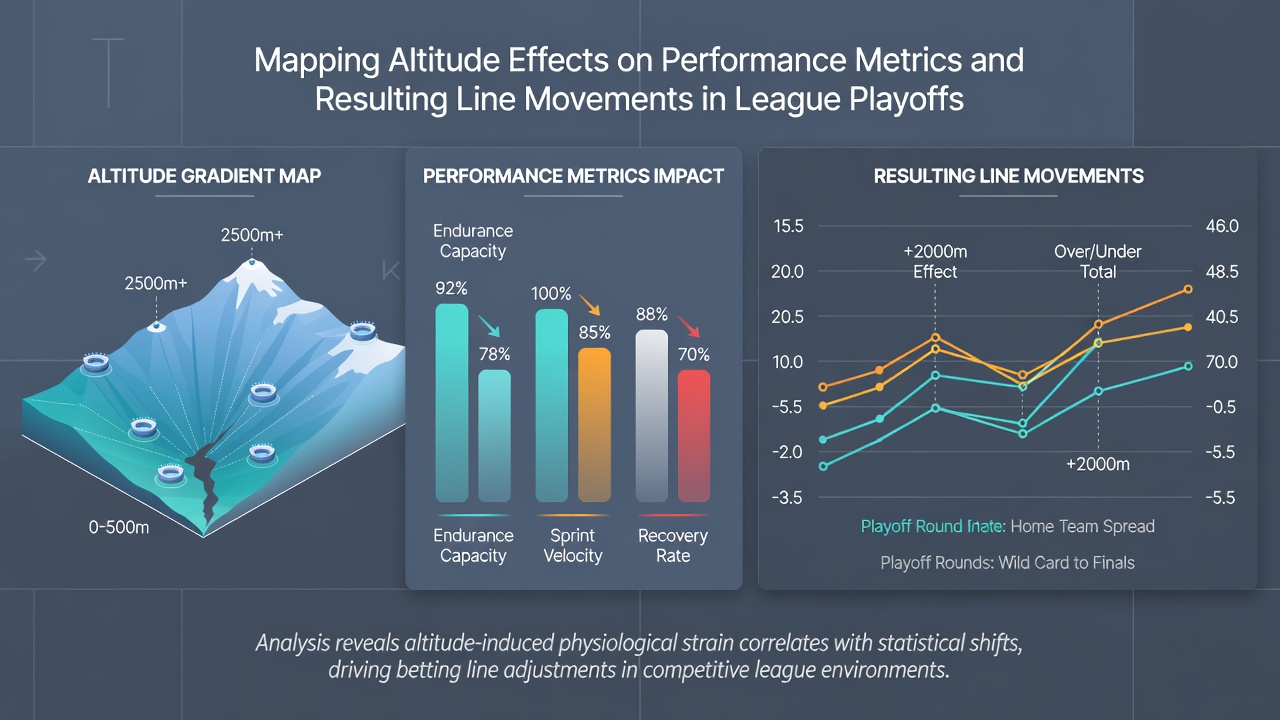
Studies from the Australian Institute of Sport reveal that players experience a 10 to 15 percent drop in repeated sprint performance when competing at 5,280 feet compared with sea-level conditions, while heart-rate recovery extends by several seconds per interval. These physiological responses appear consistently across playoff schedules where teams travel between low and high venues within short time frames.
Performance Metrics at Elevation
Tracking systems record several key variables that shift under reduced air density, including vertical jump height, distance covered at high intensity, and shot accuracy from distance. In baseball, pitchers post lower strikeout rates and higher earned-run averages during games at Coors Field, whereas hitters see elevated on-base percentages due to increased ball carry. Basketball data indicates visiting teams attempt fewer three-pointers in the first quarter when arriving in Denver, with field-goal percentages declining by roughly four points in the opening 12 minutes before partial acclimatization occurs.
Researchers monitoring NHL playoff series note that skaters log fewer high-speed shifts and accumulate more time in defensive zones during the initial periods at altitude, patterns that gradually normalize after the second intermission. These metrics feed directly into predictive models used by oddsmakers when setting series prices and in-game totals.
Line Adjustments and Movement Patterns
Bookmakers incorporate altitude-adjusted projections into opening lines, and subsequent movement often reflects sharp action from bettors who specialize in venue-specific data. Totals in Denver-hosted playoff contests open higher than neutral-site equivalents, yet they frequently drift downward once public money concentrates on the over early in the betting window. Spreads for visiting teams widen by an average of 1.5 to 2.5 points in basketball and hockey, with the largest adjustments occurring when the higher-altitude squad holds home-ice or home-court advantage in a best-of-seven series.
One documented case involved a 2024 Western Conference final where the total moved from 228.5 to 225 after overnight betting volume exceeded thresholds at multiple sportsbooks. Similar patterns emerged in baseball divisional rounds, where run totals at elevation-adjusted parks saw rapid reductions once rotation and bullpen data became public.
July 2026 Scheduling Context
League calendars released for the 2026 postseason include several high-altitude venues during late-July crossover events, particularly in international exhibition tie-ins that feed into regular playoff qualification. Observers note that teams with limited prior exposure to 4,000-plus-foot elevations receive shorter acclimatization windows, amplifying the performance gaps captured in historical datasets. These compressed timelines produce sharper line volatility during the first 48 hours after opening numbers appear.
Canadian Olympic Committee reports on multi-sport altitude training indicate that structured pre-event camps lasting five to seven days can offset roughly half of the measured aerobic decline, information that surfaces in advance of July contests and influences both team preparation and market pricing.
Data Integration Across Leagues
League-wide tracking platforms now aggregate player-tracking coordinates with environmental sensors, allowing models to weight altitude as a continuous variable rather than a binary home-road factor. This granularity reveals that certain position groups experience larger deviations: power forwards in basketball cover 12 percent less ground at elevation, while relief pitchers in baseball show pronounced increases in fastball velocity loss after the 25th pitch of an appearance.
Line movement accelerates when these position-specific figures combine with travel-fatigue multipliers, producing totals and spreads that diverge from season-long averages within hours of release. Markets in soccer and tennis that occasionally feature high-altitude playoff qualifiers demonstrate parallel behavior, though the magnitude remains smaller due to shorter match durations.
Conclusion
Altitude mapping continues to refine how performance metrics translate into wagering adjustments across league playoffs, with updated datasets from 2026 schedules expected to sharpen those correlations further. Continuous monitoring of oxygen-related indicators and line trajectories supplies the factual foundation for understanding these venue-driven dynamics without reliance on subjective interpretation.