Performance Data's Influence on Seasonal Event Pricing Patterns
Ines Lehmann · Jul 20, 2026
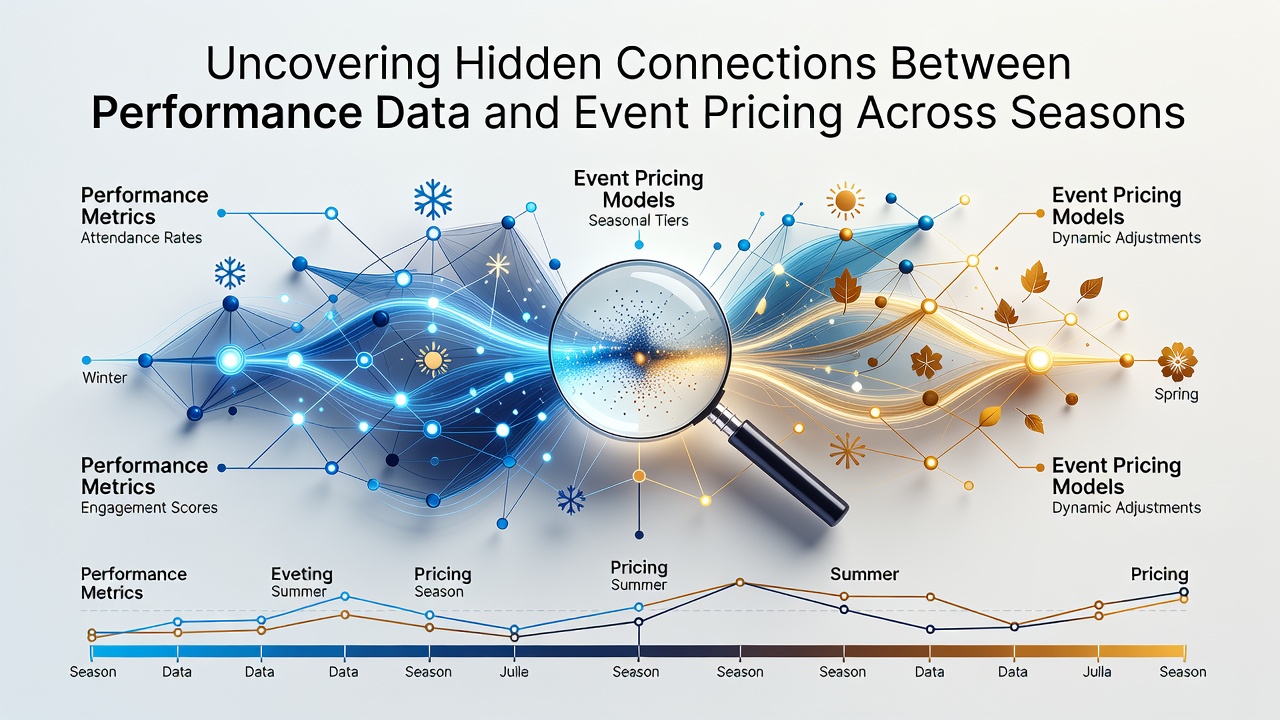
Performance Data's Influence on Seasonal Event Pricing Patterns
Analysts track performance metrics from prior seasons to determine how event organizers adjust pricing structures for upcoming competitions, and this process reveals patterns that connect athletic output directly to cost fluctuations across multiple leagues. Data from various sports shows that teams with consistent winning records often command higher baseline prices for matches while those experiencing declines see reductions that reflect adjusted expectations from organizers and vendors.
Seasonal Shifts in Metrics and Costs
Performance indicators such as points scored, defensive efficiency and player availability feed into pricing models that event planners refine each year, and these models incorporate historical trends to predict demand levels more accurately than simple calendar-based approaches. Researchers at academic institutions have documented cases where a single standout season leads to sustained price increases for the following two cycles even when later results moderate, which demonstrates how initial momentum carries forward in pricing decisions.
Event pricing across seasons also accounts for broader league standings and individual athlete contributions, so a league that sees several high-performing clubs clustered at the top tends to raise average ticket and access fees while mid-tier groups maintain steadier rates. Figures released by the Australian Sports Commission in recent years indicate that such adjustments occur most visibly between spring and fall schedules when cumulative data from winter competitions becomes fully available for review.
Data Integration Across Multiple Leagues
Organizations compile performance statistics from domestic and international competitions to create layered pricing frameworks, and these frameworks weigh factors like injury rates alongside win percentages to set dynamic ranges that change as seasons progress. One study conducted by a Canadian research group found direct correlations between offensive output trends and premium seating costs in basketball and hockey events, with stronger statistical links appearing during championship qualification periods.
July 2026 data compilations highlighted how early-season slumps in European football leagues prompted organizers to offer adjusted packages for remaining fixtures, whereas North American counterparts maintained firmer pricing due to longer schedule buffers. Observers note that these regional differences arise because performance data collection methods vary in frequency and depth, which affects how quickly pricing teams respond to emerging patterns.

Additional connections surface when performance data includes advanced analytics such as expected goal values or possession metrics, and these elements allow pricing specialists to forecast revenue shifts with greater precision across successive seasons. Industry reports from European trade associations show that clubs integrating such granular statistics into their models achieve more stable pricing outcomes compared with those relying on basic win-loss records alone.
External Factors Shaping Pricing Responses
Broader economic conditions intersect with performance trends to influence final event costs, so periods of strong athletic results during economic recovery phases often coincide with moderate price uplifts rather than sharp increases. Regulatory bodies in multiple jurisdictions monitor these interactions to ensure transparency in how data informs consumer-facing rates, and this oversight encourages organizers to document their methodologies clearly.
Case examples from Australian and North American leagues illustrate how a mid-season surge in team performance can trigger targeted promotions or price holds that carry into the next campaign, whereas prolonged poor results lead to sustained discounts aimed at maintaining attendance figures. Those who've examined multi-year datasets observe that the strongest hidden connections appear when performance metrics are cross-referenced with venue capacity utilization rates over time.
Conclusion
Performance data continues to drive nuanced adjustments in event pricing structures across seasons as organizers refine their approaches based on accumulating statistics and regional variations. The documented patterns underscore how athletic metrics serve as foundational inputs for cost decisions that evolve with each new cycle of competition. Continued examination of these links provides clearer insight into the mechanisms that connect on-field results with financial planning in the events sector.