Revealing Data-Driven Trends in College Athletic Ticket Pricing
Iris Krause · May 27, 2026
Revealing Data-Driven Trends in College Athletic Ticket Pricing
Collegiate athletic events generate substantial revenue through ticket sales, and data analysis has uncovered consistent patterns in how institutions set and adjust pricing models over recent seasons. Researchers examining sales records from Division I programs have identified recurring cycles tied to team performance, venue capacity, and broader economic indicators that shape fan demand throughout the academic year.
Core Data Sources Driving Pricing Insights
Institutions compile extensive datasets from point-of-sale systems, online platforms, and secondary markets to monitor transaction volumes and price elasticity. These records reveal that programs in power conferences often apply tiered structures where premium matchups command higher rates while midweek contests see more moderate adjustments, allowing athletic departments to balance accessibility with revenue targets. Studies from academic researchers at various universities show clear correlations between historical attendance figures and subsequent price calibrations, particularly when teams enter postseason contention.
Observed Patterns Across Seasons
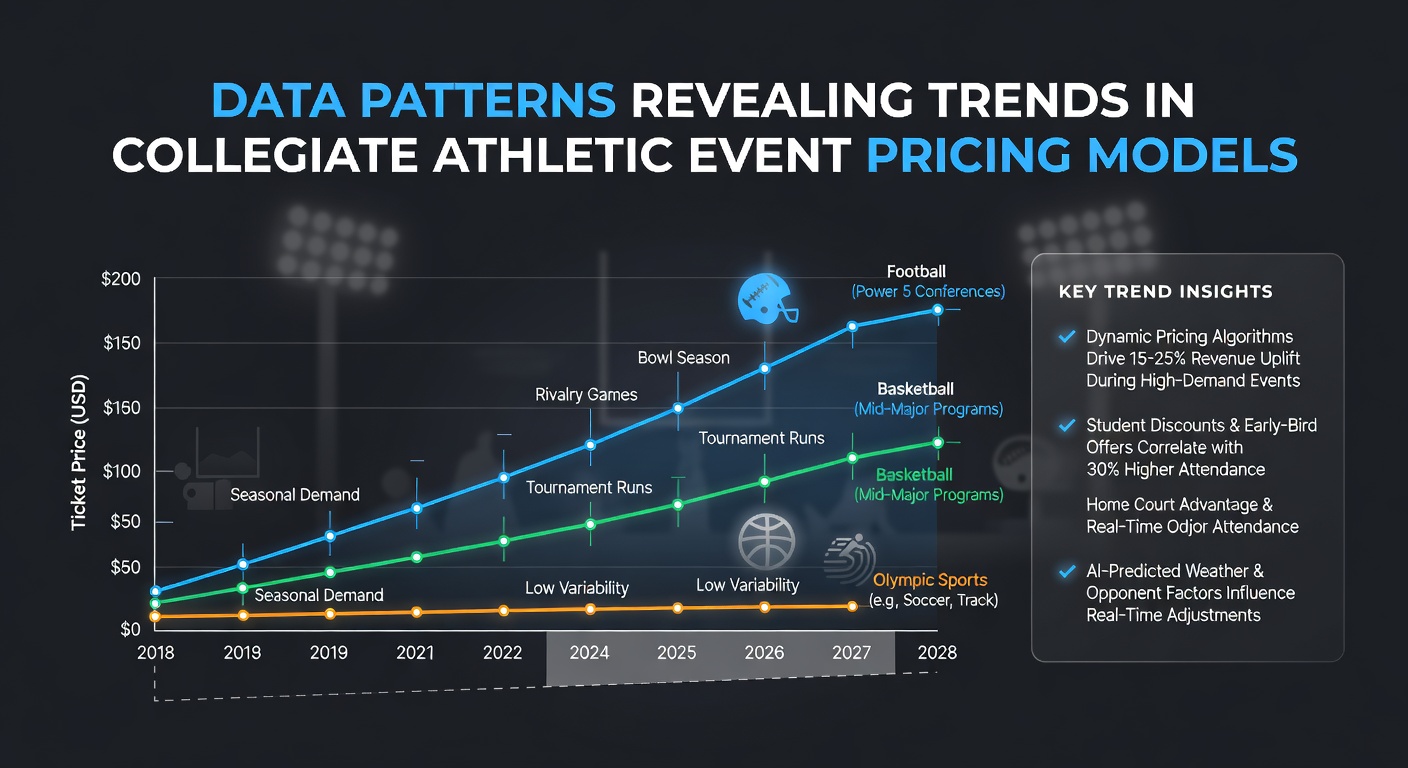
Analysis of multiple years of data indicates that ticket prices for football and basketball events tend to rise steadily in line with winning percentages, yet remain responsive to external factors such as regional economic conditions and competing entertainment options. Observers note that dynamic pricing algorithms, now adopted by many athletic departments, automatically elevate costs during high-demand periods while offering discounts to fill seats during lower-interest games. This approach has produced measurable shifts in average revenue per attendee, according to reports compiled by the National Collegiate Athletic Association.
One pattern stands out in conference-level comparisons: schools with strong rivalries demonstrate sharper price spikes around those specific contests, whereas non-conference games often follow flatter trajectories unless national rankings intervene. Data collected through 2025 illustrates how these fluctuations help departments optimize inventory without alienating core supporters who attend regularly.
Factors Influencing Model Adjustments
Multiple variables feed into pricing decisions, including student enrollment trends, alumni engagement metrics, and even weather forecasts for outdoor venues. Athletic administrators integrate these elements into predictive models that forecast demand weeks in advance, enabling proactive rate changes rather than reactive ones. Evidence from institutional financial statements suggests that programs leveraging comprehensive analytics achieve more stable year-over-year revenue growth compared with those relying on static pricing grids.
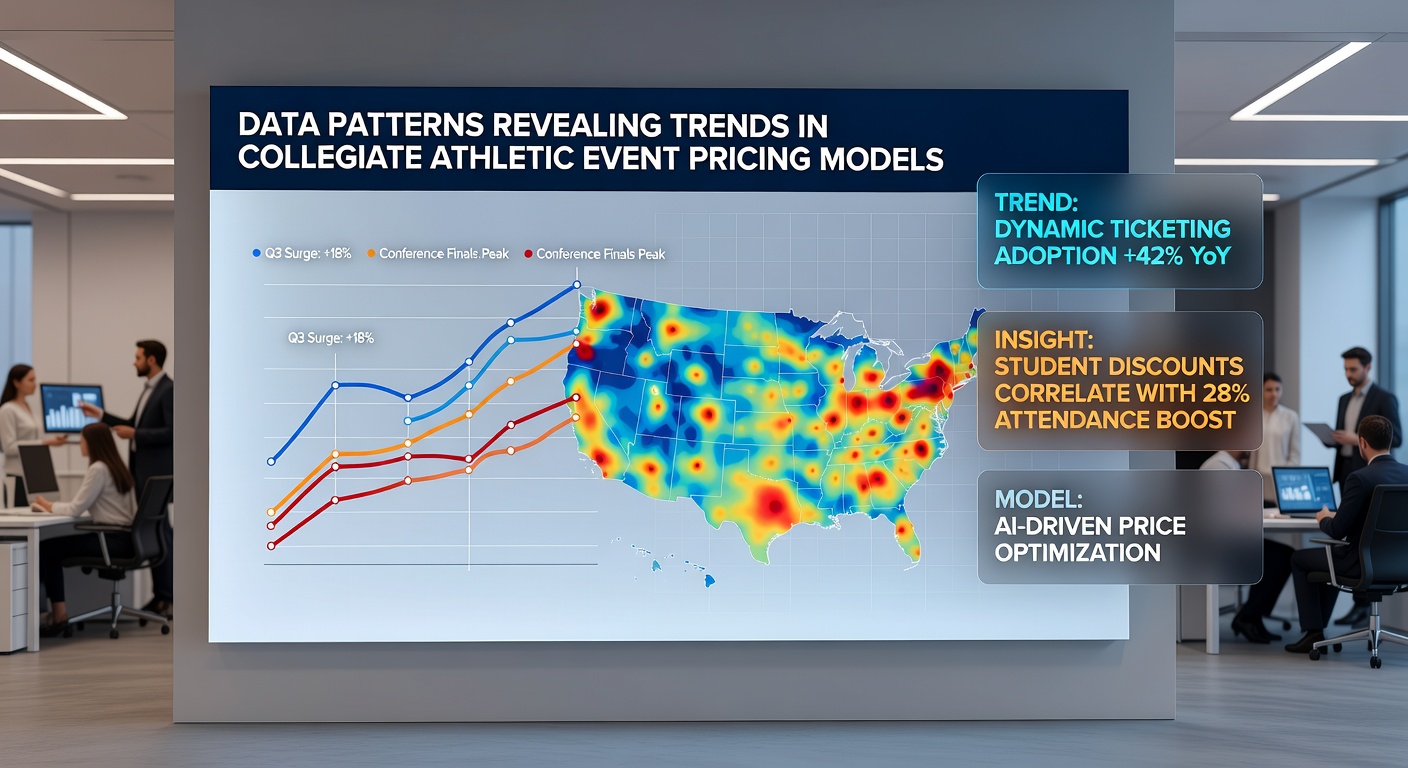
Geographic location also plays a documented role, with programs in densely populated markets showing greater flexibility to test premium packages and bundled offerings. In contrast, institutions in smaller communities maintain steadier rates to sustain consistent local attendance. Data from the 2024-2025 cycle highlighted how inflation metrics and fuel costs indirectly influenced travel-related ticket purchases, prompting some departments to introduce localized promotions.
Case Examples from Recent Cycles
Take one major conference program whose ticket office tracked a 12 percent increase in average prices for conference games following an undefeated regular season, a move supported by sustained sellouts and secondary-market premiums. Another institution adjusted midseason rates downward for non-televised events after internal data flagged softening advance sales, which ultimately preserved overall attendance figures. Such adaptations demonstrate how granular analysis supports targeted interventions rather than broad increases across an entire schedule.
Additional records from the 2025 season indicate that student ticket allocations and group packages remain key levers for maintaining accessibility, even as general public rates reflect demand signals more closely. Programs that segment their data by buyer demographics have refined these allocations to reduce no-shows while maximizing gate receipts.
Developments Projected Through May 2026
Forward-looking models based on current datasets point to continued adoption of AI-enhanced pricing tools by additional athletic departments entering the 2026 cycle. Preliminary figures suggest modest overall increases tied to facility upgrades and expanded digital ticketing infrastructure, with particular emphasis on mobile integration that streamlines purchases and captures real-time demand data. Reports from industry trade groups highlight ongoing experimentation with subscription-style season packages that provide flexibility while locking in baseline revenue.
These projections align with broader trends in event management where data transparency allows fans to understand price rationale through published demand indicators. As institutions prepare schedules for the upcoming academic year, the integration of multi-year trend analysis appears set to guide more precise calibrations ahead of the May 2026 planning window.
Conclusion
Comprehensive examination of available records confirms that collegiate athletic event pricing continues to evolve through systematic data evaluation rather than arbitrary adjustments. Patterns identified across conferences illustrate responsive strategies that account for performance, market conditions, and operational goals, producing measurable outcomes in both revenue and attendance metrics. Continued refinement of these models will likely depend on expanding datasets and improved analytical capabilities at institutions nationwide.