Venue Factors Driving Adjustments in Seasonal Prop Bet Markets
Katja Albrecht · Jun 3, 2026
Venue Factors Driving Adjustments in Seasonal Prop Bet Markets
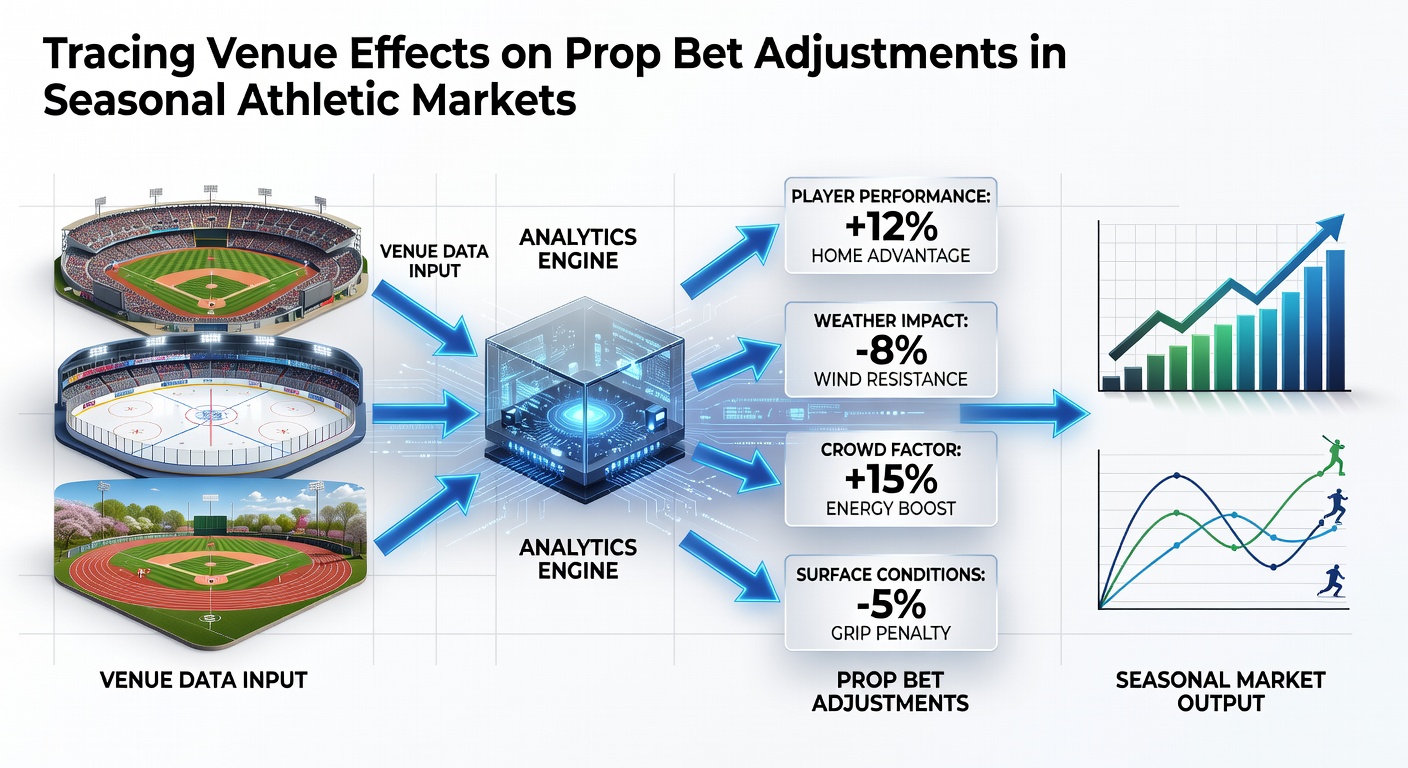
Professional sports betting markets track venue-specific data when setting proposition wagers on individual player outputs, and these adjustments follow measurable patterns across full league calendars. Analysts compile performance records from home arenas, road venues, and neutral sites to refine lines on points, rebounds, assists, and other measurable statistics. Seasonal athletic markets operate on fixed schedules that repeat annual cycles, allowing bookmakers to update models with fresh inputs each year.
Core Variables That Shape Prop Lines
Altitude, court dimensions, climate controls, and travel distances rank among the primary elements that influence statistical outputs in different facilities. High-elevation sites such as those in Denver produce documented increases in scoring rates for certain skill positions because thinner air affects ball trajectory and player endurance. Indoor arenas with consistent temperature and humidity reduce variance in shooting percentages compared with outdoor or open-air stadiums used in baseball and football. Observers note that shorter travel legs within a division often correlate with steadier performance metrics, while cross-country flights precede measurable dips in efficiency for visiting squads.
Researchers at institutions tracking league-wide data have compiled multi-year datasets that isolate these venue contributions from team strength and schedule difficulty. The resulting coefficients feed directly into pricing engines that generate daily prop offerings. Market makers recalibrate these inputs at regular intervals to reflect both long-term trends and recent game samples.
Seasonal Patterns Across Major Leagues
Early-season prop markets rely heavily on historical venue averages because sample sizes remain small, whereas mid-season and late-season lines incorporate larger data pools that capture fatigue and adaptation effects. In basketball, for example, back-to-back road games at high-altitude venues frequently trigger downward revisions on player efficiency ratings. Baseball markets adjust strikeout and home-run props based on park factors that remain stable year after year yet still interact with weather and daylight length as seasons progress.
By June 2026, several leagues will have completed enough regular-season contests for algorithms to weight current-year venue results more heavily than multi-year baselines. This shift occurs because updated models detect whether a particular arena continues to suppress or inflate certain statistics relative to league norms. Bettors and operators both monitor these recalibrations through publicly released closing-line data that reveals how sharply lines moved from open to close at each site.
Market Response and Line Movement Mechanics
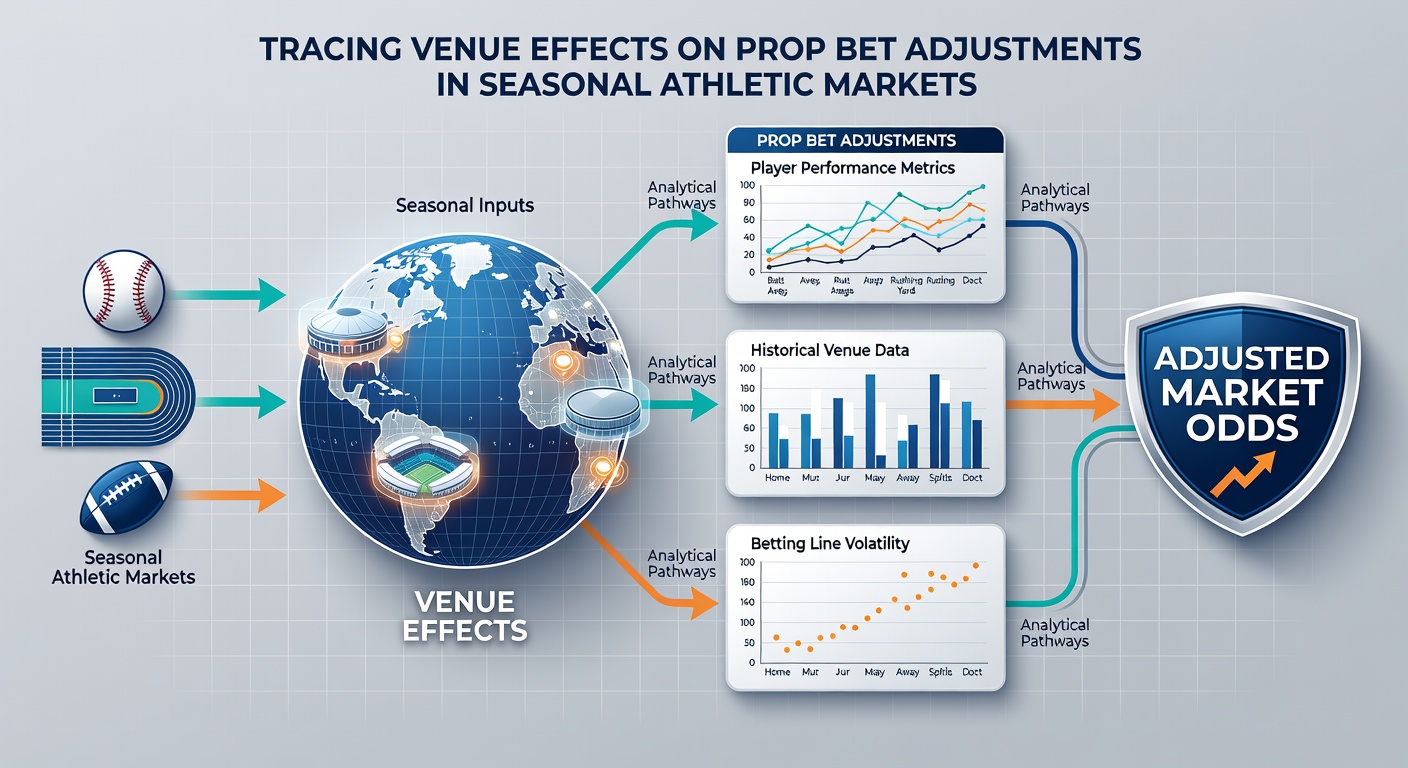
Oddsmakers release initial prop numbers using blended venue multipliers, then allow sharp action and limit adjustments to refine the market. When large wagers concentrate on one side at a specific arena, lines shift to balance liability while still embedding the underlying venue edge. Automated systems flag statistically significant deviations between expected and actual outputs, prompting manual review teams to verify whether a temporary factor such as court maintenance or crowd capacity has altered the environment.
Industry reports from the Canadian Centre for Gaming Research document how these feedback loops operate across North American sportsbooks. The same reports note that European operators apply comparable venue overlays when handling international basketball and hockey props, although regulatory frameworks differ by jurisdiction. Cross-border data sharing remains limited, yet aggregated performance databases continue to expand through private analytics firms.
Examples from Recent Campaigns
One widely cited case involved a Western Conference basketball squad whose rebounding props consistently exceeded projections at two specific road venues during the 2024-2025 schedule. Subsequent model updates raised the venue multiplier for those arenas, producing higher opening lines the following season. A parallel adjustment occurred in baseball when a park with unusually high outfield dimensions posted lower extra-base hit rates than its historical average, prompting modest downward revisions on player total-base props for visiting lineups.
These modifications illustrate how venue data flows into pricing engines on a rolling basis. Operators maintain audit trails that link each line change to specific statistical triggers, satisfying internal risk protocols and external compliance requirements.
Conclusion
Venue effects remain a measurable component of prop bet construction across seasonal athletic markets. Continuous data collection, model refinement, and real-time line monitoring allow operators to embed location-specific factors into daily offerings while responding to incoming wagers. As additional seasons accumulate, the precision of these adjustments continues to improve through expanded sample sizes and refined statistical techniques.